5 On-Chain Signals Are Pointing the Same Direction on Bitcoin.
Your social media feed right now is probably full of people declaring that crypto is finished. Bitcoin is down roughly 16% on the month, down nearly 25% on the year, sitting around 15% below its 200-day moving average.
Last verified Also on Medium

On this page
- The Foundation: What the MVRV Z-Score Is Saying
- Signal 2: Fear and Greed at Levels That Have Preceded Major Recoveries
- Signal 3: The Capitulation Data on the Chain
- Signal 4: What Happened in the ETF Market and What It Tells You
- Signal 5: Market Breadth at Cycle Extremes
- The Genuine Bear Case Deserves Equal Space
- What to Actually Watch From Here
Your social media feed right now is probably full of people declaring that crypto is finished. Bitcoin is down roughly 16% on the month, down nearly 25% on the year, sitting around 15% below its 200-day moving average. The Fear and Greed Index touched single digits twice in June, something it has only done at genuine market extremes. ETF money left for 13 consecutive trading days.
The pain is real. That part is not in dispute.
What is worth examining separately from the sentiment is the on-chain data, because on-chain data does not panic. It simply records what is happening. Which coins are moving, at what price, in which direction, held by whom. , when you look at what the on-chain data is currently showing alongside the macro context, you get a picture that is considerably more nuanced than either the doomers or the permabulls are presenting.
This piece walks through five specific signals, explains what each one measures and why it matters historically, gives you the honest bear case for each one, and lets you draw your own conclusions from there.
The Foundation: What the MVRV Z-Score Is Saying
The MVRV Z-Score is the most respected on-chain valuation tool in Bitcoin analysis. According to Bitcoin Magazine Pro, it has identified every major cycle bottom and top since 2011 with remarkable accuracy. The mechanics are straightforward. It compares Bitcoin’s current market capitalisation against its realised capitalisation, which is calculated by pricing every coin at the value it last changed hands on-chain rather than today’s price. The Z-Score normalises the difference between those two figures using standard deviation, which lets you compare conditions across different market regimes.
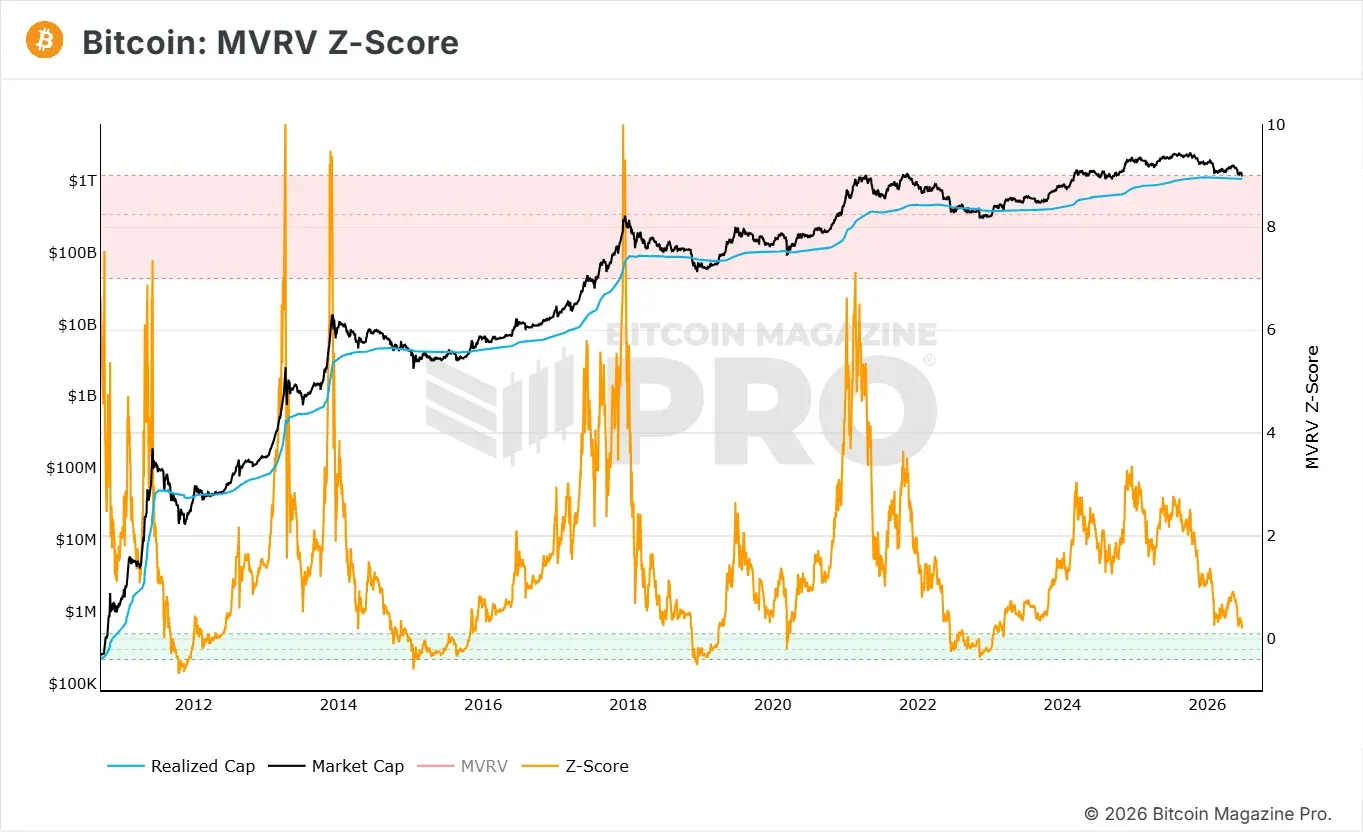
When the Z-Score is high and positive, the average holder is sitting on large unrealised gains and the market is historically frothy. When it compresses toward zero or turns negative, the average holder is at or below breakeven, and every prior occurrence of that condition has represented a historically significant buying opportunity.
The realised price, the weighted average of what all current holders paid for their Bitcoin, sits at approximately $53,600 as of mid-June 2026. Bitcoin trading at $65,000 means the average holder is in profit, but the margin is narrowing. CoinDesk reported on June 8 that the MVRV Z-Score was knocking on the door of the historical accumulation zone for the first time since the 2022 bear market low. PrimeXBT’s analysis from April 2026 placed the score at approximately 0.49 at that time, with the current reading compressing further toward the historical green accumulation band.
For context on what crossing into that zone has meant historically: the December 2018 bottom at $3,200 saw the Z-Score reach roughly negative 0.65. The March 2020 crash brought it to around negative 0.5. The FTX collapse bottom in November 2022 saw it between negative 0.4 and negative 0.5, before Bitcoin rallied from $15,500 to above $70,000 in the following cycle.
The honest caveat here is important. CoinDesk’s analysis noted that the Long-Term Holder MVRV and Short-Term Holder MVRV have not yet converged, a pattern that has historically confirmed major cycle lows in 2015, 2019, and 2022. STH-MVRV currently sits at 0.84 while LTH-MVRV remains elevated at 1.29. When these two converge, long-term holders and short-term holders reach similar profitability, and historically that convergence is what marks the final low, not the approach to it.
The Z-Score approaching the accumulation band is a signal of building opportunity. It is not a signal that the floor is confirmed. Those are meaningfully different statements, and conflating them is how people get hurt.
Signal 2: Fear and Greed at Levels That Have Preceded Major Recoveries
The Crypto Fear and Greed Index runs from 0 to 100. Anything below 25 is classified as extreme fear. The index hit 8 to 9 twice in June 2026, touched a 2026 low of 11 on June 3, and has been sitting in extreme fear for over 2 weeks, falling from greed territory near 52 in late May.
The reason this matters is mechanical rather than psychological. When the Fear and Greed Index sits in extreme fear, it means the pool of sellers who were willing to sell at current prices has largely already sold. The people who panic at a 20% drawdown are gone. Their coins have transferred to buyers who entered at lower prices with higher conviction. When sellers are exhausted, the sell side of the order book gets thin. Any positive catalyst, even a mild one, hits a market where buyers need to absorb only a trickle of supply. That is the asymmetry extreme fear creates.
The historical precedents are specific. Late 2018 single-digit fear with Bitcoin around $3,200, followed by a roughly 300% rally to $13,000 by mid-2019. March 2020 single-digit fear readings that served as the launchpad for the multi-year bull run to $69,000. November 2022 peak fear at the FTX collapse, followed by recovery to above $30,000 within months. SpottedCrypto’s on-chain analysis documented that entering the market when the Fear and Greed Index fell below 15 has historically produced median 3-month returns of plus 38%.
The caveat is that sentiment indicators can remain extreme for an agonisingly long time. In 2018, the Z-Score sat in negative territory for 133 days before any durable recovery. In 2015, after similar extreme fear readings, the market ground sideways and lower for over six months. Oversold conditions have no expiry date.
Signal 3: The Capitulation Data on the Chain
On-chain data allows researchers to watch something that traditional financial markets cannot show: the actual realised losses of every participant recorded permanently on a public ledger. When realised losses spike, it means the dominant activity in the market is people selling at a loss. That is the technical definition of capitulation.
On February 5, 2026, Bitcoin saw a single-day realised loss event of $3.2 billion as the price dropped from $70,000 toward $60,000. Glassnode data cited by SpottedCrypto confirmed that figure surpassed the peak realised loss from the Terra Luna collapse in 2022 at $2.7 billion. Long-term holders have absorbed approximately $2.4 billion in realised losses since the drawdown began.
The figure that stands out most is supply in loss. As of early June, over 50% of the entire circulating supply, roughly 10.5 million Bitcoin, sits at an unrealised loss. According to Glassnode, that 50% threshold has been crossed at every single major bear market bottom since 2015. The 2018 bottom, the 2020 crash, the 2022 FTX low: all of them saw over half of the supply in loss before the recovery began.
The honest counterpoint comes from CryptoQuant’s head of research Julio Moreno, who argues that realised losses have not yet reached the capitulation peaks needed to confirm a cycle bottom. The current 30-day figure of around 187,000 Bitcoin in losses is a fraction of the 400,000 Bitcoin lost during February’s spike and a rounding error next to the 1.2 million Bitcoin flushed during the FTX collapse. CryptoQuant analyst Axel Adler Jr points to 5 independent metrics that converge on the same conclusion that the final flush may not have happened yet.
Signal 4: What Happened in the ETF Market and What It Tells You
From May 15 to June 3, 2026, US-listed spot Bitcoin ETFs bled cash for 13 consecutive trading days, draining roughly $4.37 billion from the complex. BlackRock’s IBIT accounted for approximately $3.3 billion of those withdrawals, roughly 75% of the total. Total ETF assets fell from $104.29 billion at the start of the streak to $82.83 billion on June 3, a drawdown of over $21 billion in just three weeks.
Hedge funds slashed their Bitcoin ETF exposure by 39% in the first quarter of 2026 according to 13-F filing data. This was the longest consecutive outflow streak since the ETFs launched in January 2024, making it a historically significant data point for understanding institutionally wrapped sentiment.
The streak broke on June 5, when ETFs recorded a $3.05 million net inflow, the first positive day in nearly 3 weeks. June 12 brought $85.85 million in net inflows, the first session where zero of the 12 tracked funds posted an outflow. BlackRock’s IBIT captured approximately $57.7 million, roughly two-thirds of the daily total. Ethereum ETFs ended a concurrent 17-day outflow streak the same day.
The nuance worth holding onto is that the recovery has been heavily concentrated. BlackRock’s IBIT has been both the dominant source of redemptions and the only reliable engine of recovery on positive days. A broad-based recovery across multiple funds, rather than one dominant institution driving the flows, would be a meaningfully stronger signal. That has not yet emerged.
Cumulative lifetime net inflows into Bitcoin ETFs since January 2024 still exceed $55 billion according to Bloomberg ETF analyst Eric Balchunas, as reported by the Bitcoin Foundation. The 13-day streak gave back a significant portion of the year’s gains but did not erase the structural demand that has built since the ETF launch.
Signal 5: Market Breadth at Cycle Extremes
Breadth measures how many assets in a market are participating in the current trend. In a healthy bull market, most assets are above their long-term moving averages. In a heavily sold market, most assets have already taken their drawdowns.
Currently, between 72% and 83% of the top altcoins are trading below their 200-day moving average. According to SpottedCrypto’s March 2026 analysis, this wash-out has persisted since October 2025, with the share below the 200-day moving average grinding between 60% and 90% for months. Barely 17 to 28% of altcoins are still above their long-term trend lines. That is one of the weakest breadth readings of the entire cycle.
The mechanical insight here is that when 80% of assets are already below their long-term trend, the damage is largely done. These assets have already taken their 40 to 80% drawdowns. You cannot wash out what is already washed out. Historically, extreme breadth compressions have preceded significant recoveries when conditions eventually flip, because the compressed assets tend to move with considerable force when buying pressure returns to a market where most of the selling has already occurred.
Bitcoin dominance currently sits at 57 to 59%, the altcoin season index is languishing around 43 to 49, well below the 75 level that historically confirms capital rotation into altcoins. That gap is not a problem to solve today. It is the coiled spring that unwinds when Bitcoin dominance eventually rolls over and capital begins rotating. When that rotation happens in a market where most altcoins have already been compressed to multi-year lows, the resulting move tends to be fast and significant.
The precedents March 2024 saw nearly 90% of altcoins below their 200-day average, right before a significant altcoin rally. December 2024 flashed a similar extreme before acting as a contrarian setup.
The Genuine Bear Case Deserves Equal Space
Laying out five bullish signals without the counterarguments would be incomplete. Here is the honest case for why the floor may not be in.
The MVRV Z-Score is approaching the accumulation zone, not standing in it. At its current reading, it is where prior cycles were when they had more downside to go before finding the actual bottom. Every generational low saw the Z-Score turn negative. If that pattern holds, Galaxy Digital’s Alex Thorn has flagged $40,000 to $46,000 as a structural floor where forced selling from leveraged entities could intensify.
The capitulation thesis is incomplete by the metrics that have historically confirmed bottoms. CryptoQuant’s research shows realised losses at a fraction of what prior cycle bottoms produced. The LTH and STH MVRV convergence has not happened. Five independent metrics from CryptoQuant’s research team suggest the final flush may still be ahead.
These signals can remain extreme for longer than anyone finds comfortable. The 2018 bear market produced genuinely extreme readings for 133 consecutive days before any durable recovery. The 2015 bear market extended six months past the point where these same signals would have suggested accumulation. Oversold conditions are necessary but not sufficient for a recovery.
The macro environment is actively hostile in ways that matter for Bitcoin specifically. Goldman Sachs scrapped its 2026 rate cut forecast entirely. CME FedWatch shows a 96 to 98% probability of a hold at the June meeting. The US 10-year Treasury yields approximately 4.47%, creating a meaningful risk-free return that competes with speculative assets. Capital has been rotating into AI equities rather than crypto, a structural shift that did not exist in prior cycles.
The Puell Multiple, which measures miner revenue relative to historical norms, sits at 0.73. If it drops below 0.50 and Bitcoin falls under $55,000, miners could face pressure to sell Bitcoin to cover operating costs, adding forced supply at exactly the moment market conditions are already weak. That is a specific structural risk that deserves monitoring.
What to Actually Watch From Here
Both the bull case and the bear case are using the same 5 charts. The difference is in the interpretation of how far along each signal is and what the remaining conditions for confirmation look like. Rather than picking a side, here are the specific data points that will tell you which story is winning.
Watch the MVRV Z-Score on Glassnode or Bitcoin Magazine Pro. If it pushes decisively below zero into the historical green band, and if the LTH-MVRV and STH-MVRV converge, the accumulation case gets substantially stronger. The approach to zero matters less than actually crossing it, based on historical precedent.
Watch for a sharp spike in realised losses. CryptoQuant’s live metrics track this in real time. A final panic-driven flush comparable to the February event or, ideally, closer to the FTX-era scale would be the capitulation confirmation that is currently missing from the picture. Watch ETF flows on SoSoValue for sustained broad-based inflows across multiple funds rather than IBIT-concentrated recovery days. The June 12 session where zero funds posted outflows was encouraging. A week of that pattern would mean something. One day does not.
Watch the $55,000 level and the Puell Multiple. If Bitcoin breaks that level with the Puell Multiple below 0.50, the miner selling pressure scenario becomes active and the path toward $40,000 to $46,000 opens structurally rather than just technically.
Watch Bitcoin dominance. CoinMarketCap’s dominance chart tracks this in real time. When dominance at 57 to 59% eventually rolls over and begins declining, that is the tell that capital is rotating into the compressed altcoin market. That rotation, when it comes in a market with this level of breadth damage, tends to be rapid.
The bottom is always a process, not a moment. It is messy, choppy, and multimonth, and the signals stack up long before the chart turns green. In November 2022, all of these flashed and Bitcoin still chopped sideways for months before the recovery. The people who built positions during that period did not feel clever in the moment. They felt uncomfortable. That discomfort turned out to be the point.
5 independent signals are leaning in the same direction. The honest read is that we are closer to the end of this pain than the start, while acknowledging that closer does not mean arrived, and that one more leg lower into the structural floor zone remains a genuine possibility rather than just a tail risk.
Whether you use that framing as a reason to accumulate gradually or as a reason to wait for more confirmation depends on your risk tolerance, your time horizon, and your assessment of the macro environment. Both positions are defensible with the available data. What is not defensible is making that decision based on social media sentiment rather than on the metrics that have historically had predictive value at market extremes.
Sources
- Bitcoin Magazine Pro: MVRV Z-Score Chart and Explanation — Historical MVRV Z-Score data, green accumulation zone thresholds, and cycle bottom identification going back to 2011.bitcoinmagazinepro.com. Accessed 28 June 2026.
- CoinDesk: Bitcoin’s MVRV Z-Score Nears Historical Bottom Zone, June 8, 2026 — LTH-MVRV at 1.29, STH-MVRV at 0.84. Convergence not yet reached. Current Z-Score knocking on accumulation zone.coindesk.com. Accessed 28 June 2026.
- PrimeXBT: Bitcoin’s MVRV Z-Score Flashing Rare Undervaluation Signal, April 2026 — Z-Score at 0.49 in April 2026. Global liquidity cycle context. Bitcoin correlates with global liquidity 83% of the time over 12-month periods.primexbt.com. Accessed 28 June 2026.
- Axel Adler Jr: MVRV Z-Score Bitcoin Cycle Analysis — Z-Score spent 44% of time in green zone historically. Five independent metrics on incomplete capitulation thesis.axeladlerjr.com. Accessed 28 June 2026.
- SpottedCrypto: Bitcoin On-Chain Bottom Signals March 2026 — MVRV Z-Score at 1.2 in March 2026. SOPR below 1.0. Fear and Greed below 15 historically produces median 3-month returns of 38%.spotedcrypto.com. Accessed 28 June 2026.
- CoinMarketCap: Crypto Fear and Greed Index — Live index tracking. June 3, 2026 low of 11. Historical extreme fear context.coinmarketcap.com. Accessed 28 June 2026.
- Glassnode: Bitcoin Market On-Chain Metrics — Supply in loss crossing 50% at every major bottom since 2015. Realised loss data.glassnode.com. Accessed 28 June 2026.
- Crypto.news : Bitcoin ETF 13-Day Outflow Streak Analysis — Full breakdown of May 15 to June 3 streak. $4.37 billion total. BlackRock IBIT $3.3 billion of withdrawals.crypto.news. Accessed 28 June 2026.
- TFTC: Bitcoin ETFs Shed $7 Billion Across Two Record Outflow Streaks — Combined 2026 outflow data. June streak ended June 5. Ethereum ETFs concurrent 17-day streak.tftc.io. Accessed 28 June 2026.
- Bitcoin.com News: Bitcoin ETF Inflows June 12, 2026 — $85.85 million net inflows June 12. Zero outflows across all 12 funds. IBIT two-thirds of total.bitcoin.com. Accessed 28 June 2026.
- Bitcoin Foundation: ETF Outflows June 2026 Data — $55 billion cumulative lifetime inflows still intact. Bloomberg ETF analyst Eric Balchunas commentary.bitcoinfoundation.org. Accessed 28 June 2026.
- CoinDesk: Bitcoin and Ether ETFs End Record Outflow Streak, June 5, 2026 — $3.05 million net inflow ends the 13-day streak. IBIT FBTC breakdown. Total assets at $80.40 billion.coindesk.com. Accessed 28 June 2026.
- Goldman Sachs: US Economic Outlook 2026 — Rate cut forecast scrapped entirely. Macro context for Bitcoin headwinds.goldmansachs.com. Accessed 28 June 2026.
- SoSoValue: US Spot Bitcoin ETF Flow Data — Live ETF flow tracking for all 12 US spot Bitcoin ETFs.sosovalue.com. Accessed 28 June 2026.
- CoinMarketCap: Bitcoin Dominance Chart — Live Bitcoin dominance tracking. Current range 57 to 59%.coinmarketcap.com. Accessed 28 June 2026.
- CryptoQuant: Bitcoin Realised Profit and Loss Ratio — Live on-chain data for realised losses and capitulation tracking.cryptoquant.com. Accessed 28 June 2026.
Related stories
Crypto & markets
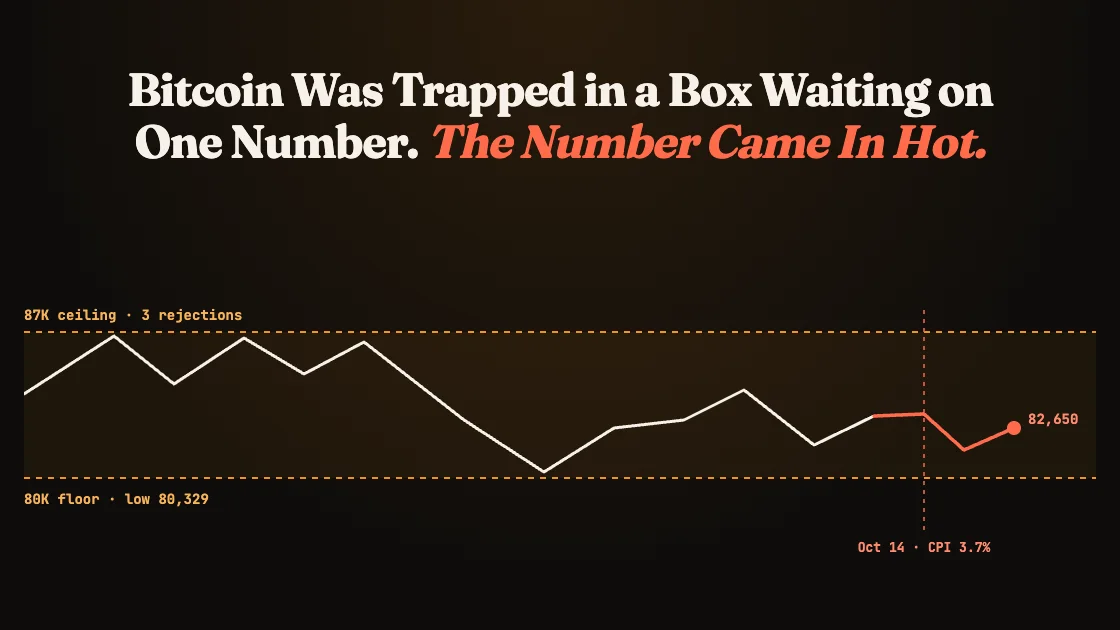
Bitcoin Was Trapped in a Box Waiting on One Number. The Number Came In Hot
A ceiling near 87K, a floor near 80K, and $800 million of liquidations in between. Then the September CPI ran hot, yields jumped, and Bitcoin slid under 82K. Here is how the range was built and how it broke. None of this is financial advice. Prices and levels in this piece are as of October 14, 2026. Bitcoin and bond yields move daily.

Crypto & markets
Wall Street Filed an Automatic Bitcoin Buyer. It Runs on Stock Dividends.
On June 18, 2026, Franklin Templeton, a $1.5 trillion asset manager founded in 1947, filed registration statements with the SEC for 2 exchange-traded funds built around one of the oldest and most boring ideas in finance. A dividend reinvestment plan. The twist is where the dividends go.
Crypto & markets
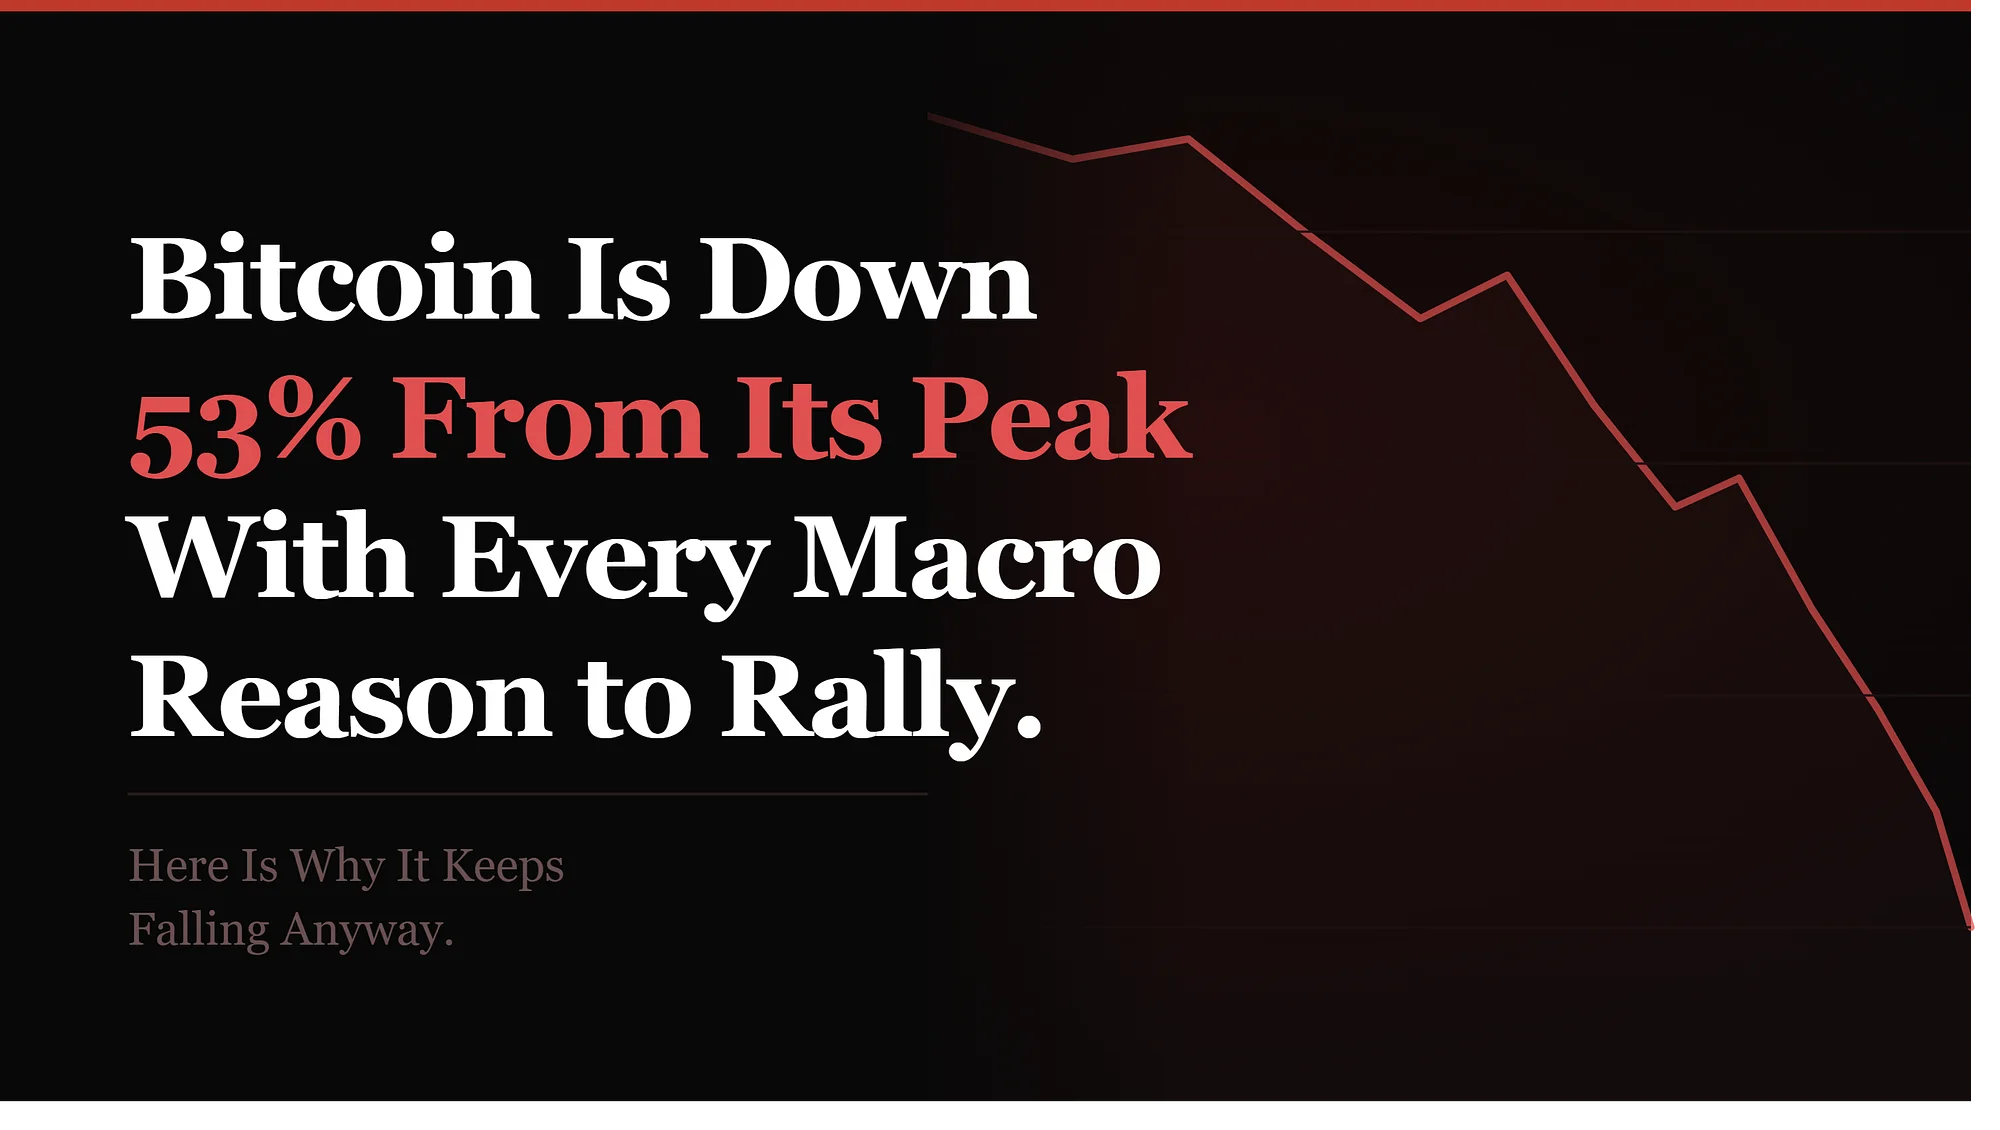
Bitcoin Is Down 53% From Its Peak With Every Macro Reason to Rally.
Bitcoin dipped to an intraday low of $59,100 on June 5, 2026, its lowest level since September 2024, marking a 53% collapse from the $126,272 all-time high it set in October 2025. The Block confirmed Bitcoin trading near $60,750 on June 28, down more than half from its October peak.